


What are some of the key market drivers for woodworkers in the construction-based sectors, and what investments are being made to advance their capabilities?
For perspective, the total value of private construction (residential and nonresidential) in the United States was $1.65 trillion in 2025 ($1,652,340 million), down 2.6% from 2024 based on U.S. Census Bureau figures. This decrease was driven by declines in all sectors except residential improvements. Specifically, spending decreased for single-family housing (-3.4%), multi-family construction (-9.1%), and nonresidential construction (-3.2%) in 2025. In contrast, spending on residential improvements (referred to as repair and remodeling in this article) increased by 1.2%.
The number of single-family housing units started in 2025 was 939,700, which was a 7.2% decrease from 2024 and was the lowest volume since 2020. Single-family housing starts remained well below the peak of nearly 1,716,000 units in 2005. Multi-family starts were 416,100 in 2025, up 17.5% from 2024, despite multi-family spending being down by 9.1%.
Against this backdrop, the 17th annual housing market study was conducted in early 2026 to assess market conditions for secondary woodworking manufacturers involved in construction-based and related sectors. Information is provided on the status and current activities of manufacturers, as well as an analysis of what has changed since last year.
This study is a joint effort by Virginia Tech, the USDA Forest Service, and Woodworking Network/FDMC (see “About the Survey” for details about the study design and respondent characteristics).
Changes in sales, markets & production
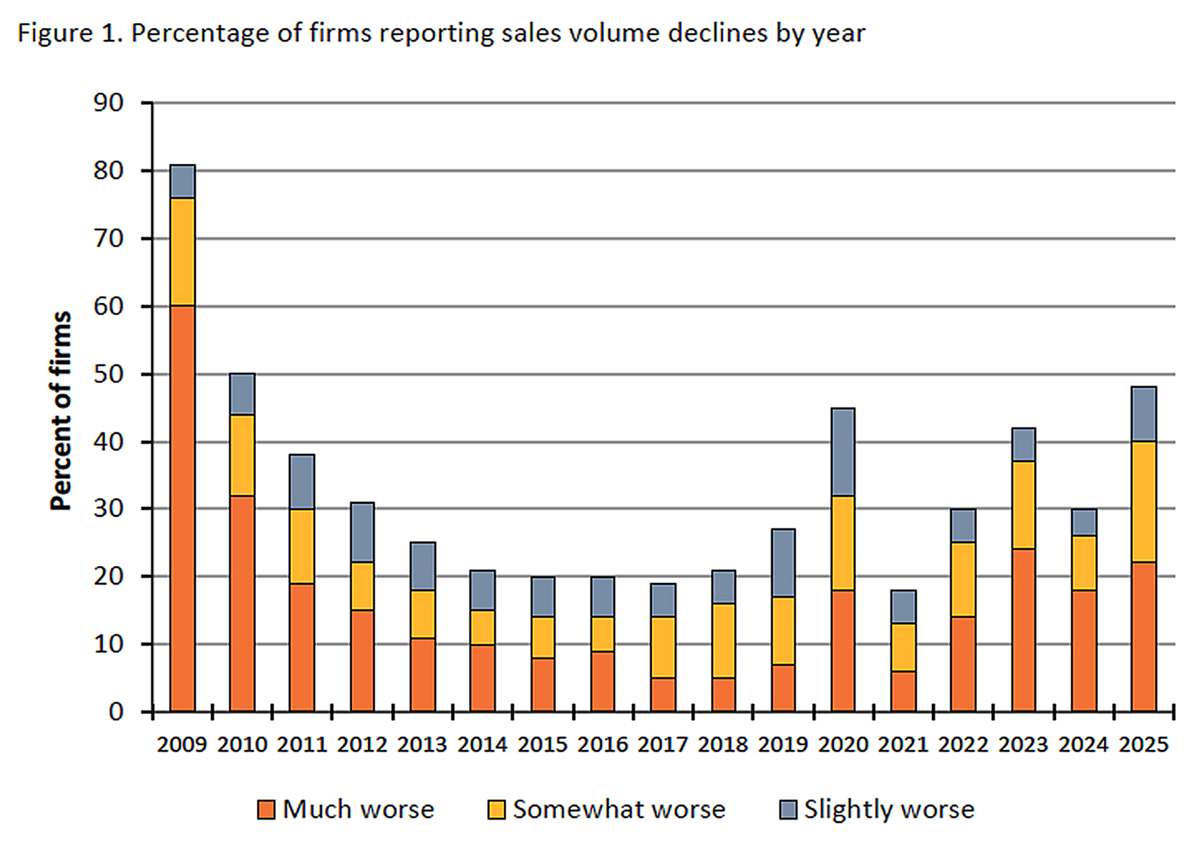
The number of firms reporting an annual decline in sales volume generally has been increasing since 2021 after a short-lived market recovery associated with the lessening of COVID-related disruptions (Figure 1). For 2025, there was an increase in the number of firms reporting a sales volume decline, with 48% of respondents reporting that sales were worse (compared to 30% last year). This percentage was similar to the spike in 2020 associated with COVID and remains elevated from the relatively low levels seen from 2014 to 2018, which were closer to 20% annually.
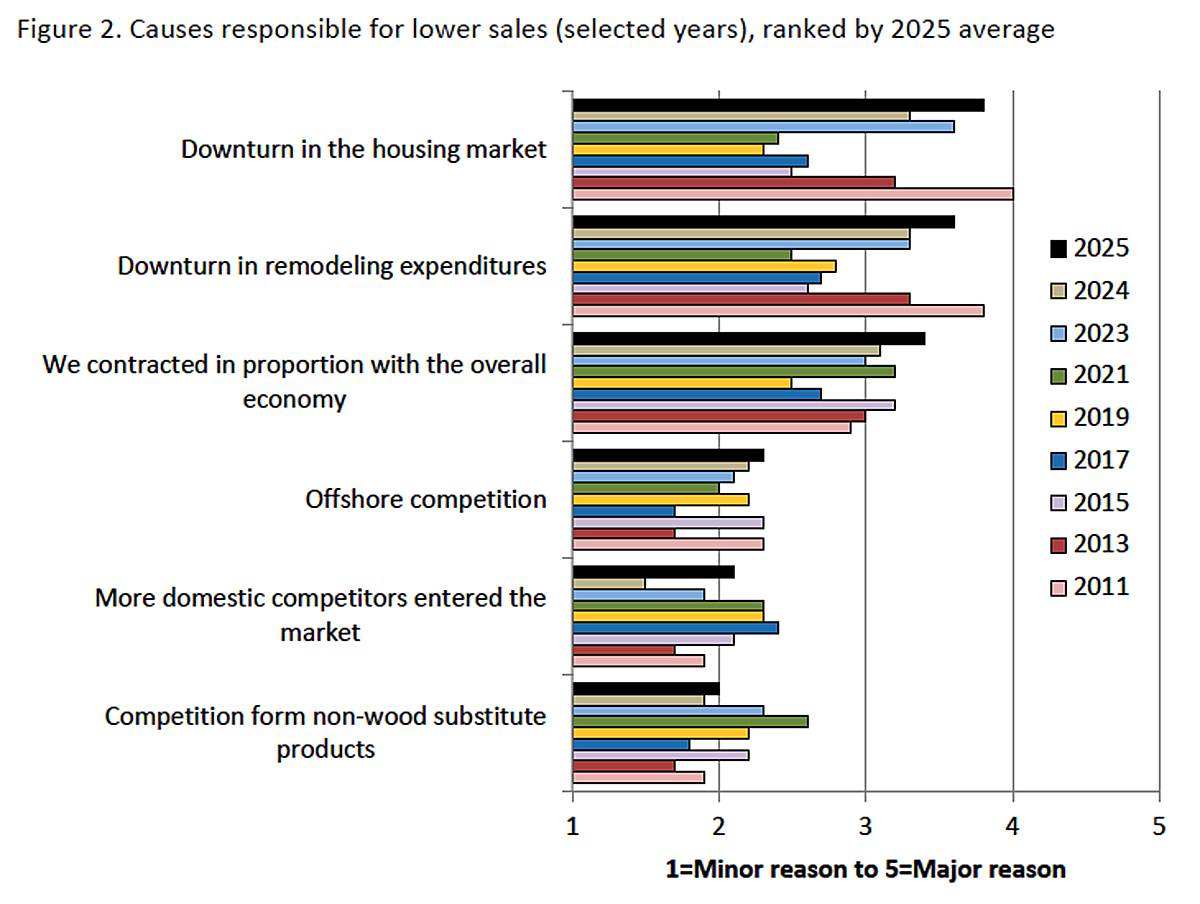
Respondents largely attributed their loss of sales volume in 2025 to downturns in the housing market and the remodeling market, followed closely by perceptions of the state of the overall economy (Figure 2). As causes for sales declines, the downturns in housing and remodeling for 2025 were rated similarly to 2011, when the market was just starting to emerge from the housing crisis of 2008. Offshore competition, more domestic competition, and competition from non-wood substitutes were all rated relatively low as causes for sales declines, similar to past years.
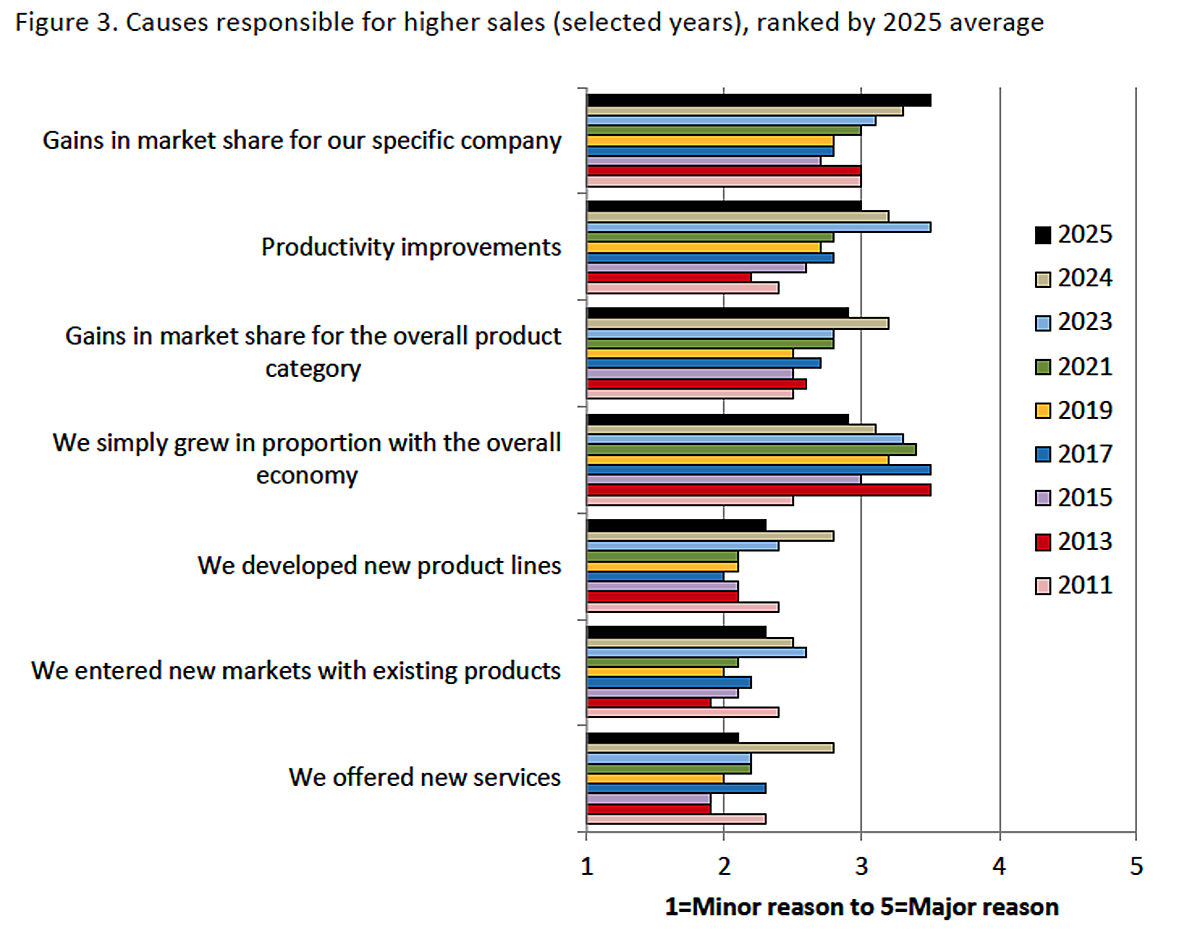
Even though 48% of respondents lost sales volume in 2025, another 44% of respondents reported sales volume increases (8% were unchanged). Those firms with increased sales volume attributed success mostly to factors internal to their specific company, most notably productivity increases (Figure 3). Respondents were less likely to say the overall economy was a reason for growth, continuing to follow the general trend for this question since 2013. Respondents with sales growth for 2025 did not rate new product lines, new markets, or the offering of new services as major reasons for their growth.
For the 2026 study, 26% of respondents had most of their production volume (61%-100%) associated with the repair and remodeling market. In addition, 26% had most of their production volume in single-family housing. Just 8% and 3% had most of their production volume in the nonresidential and multi-family housing markets, respectively. This underlines the relative importance of repair and remodeling and single-family housing construction to the secondary woodworking industry (i.e., less wood products generally are used in multi-family and nonresidential construction per unit).
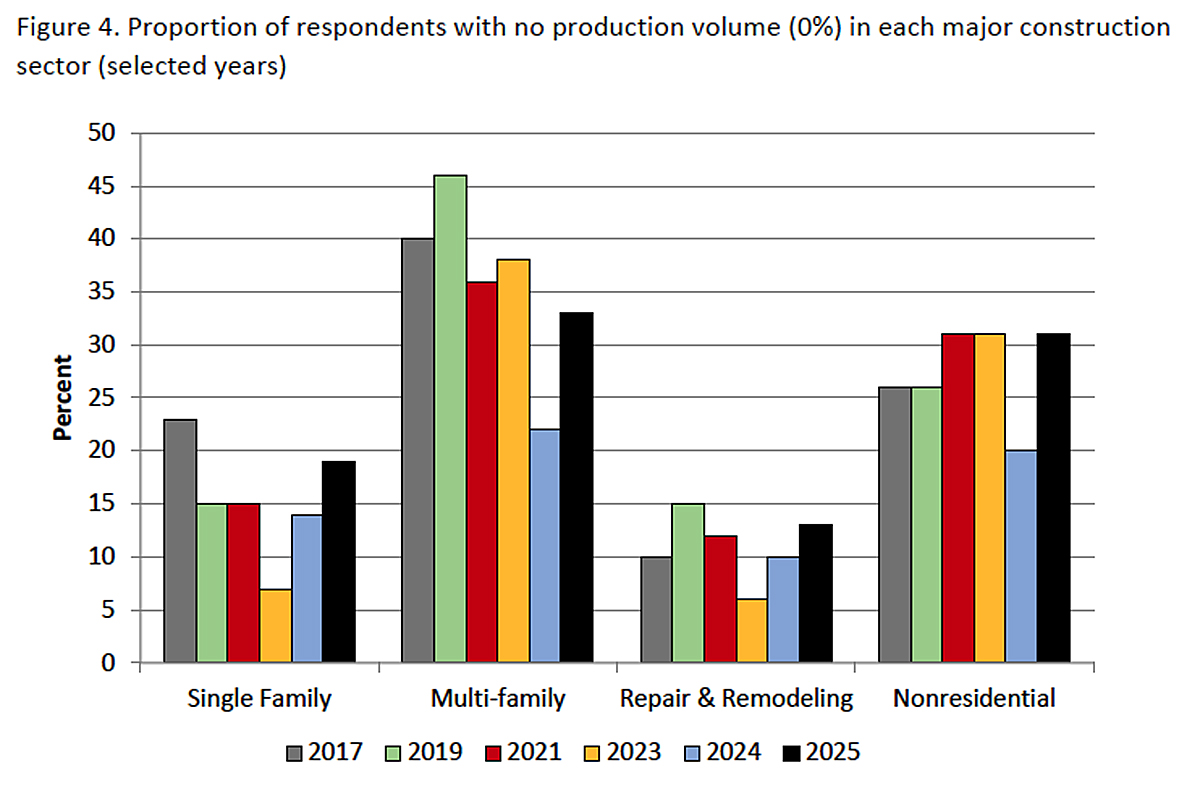
Just 19% and 13% of respondents had no business activity in the single-family housing and repair and remodeling markets, respectively, in 2025, although these were increases from the previous two years (Figure 4). In contrast, approximately a third of respondents had no business activity in the multi-family and nonresidential categories, which were increases from last year.
Green building products are another market possibility for secondary woodworkers to leverage sales volume. However, across most study years, the number of respondents indicating they have seen increased interest from customers seeking to source products compliant with green building standards programs has declined or remained steady. This year, 18% of respondents reported they had seen an increase. Most respondents continued to indicate they had not seen an increase (66%), with the remaining 17% being uncertain if interest in green products had increased.
Demand for made-to-order (MTO) production continues to be important for the woodworking industry. For 2026, 59% of respondents indicated that MTO production was greater than four-fifths of their overall product mix. This figure was 70% of respondents in 2010 (the first year of the study) but had dropped to 49% and 47%, respectively, in 2022 and 2023.
Respondents also continued to be domestically focused, with 6 in 10 indicating that more than 60% of their 2026 sales would result from domestically produced and/or sourced products. Conversely, 34% of respondents indicated that they had increased the use of wood imports (either lumber/components, finished products, or both) in their respective product lines over the past five years. The industry also continues to target higher price-points, with 53% of respondents reporting they operated at a medium-high to high price-point.
Planned investment activities
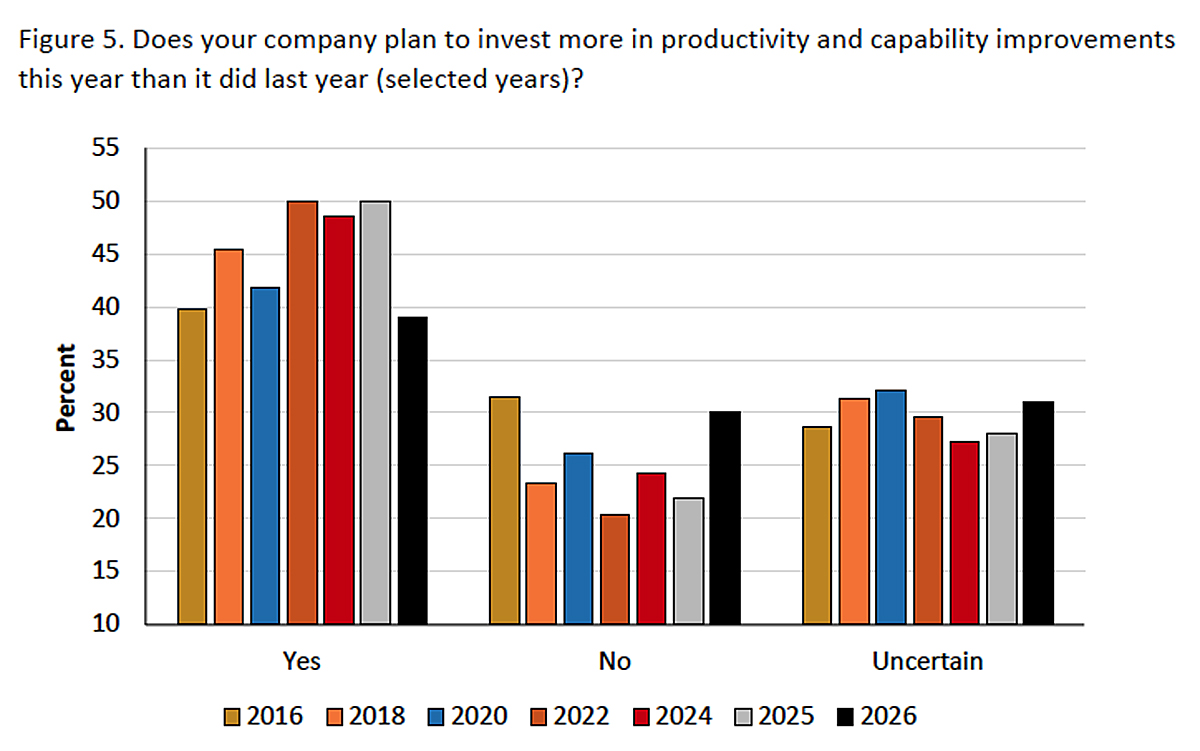
When it comes to their business (Figure 5), 39% of respondents planned to spend more on investments in productivity and capability improvements in 2026 than in 2025, whereas 30% planned to spend less and 31% were uncertain. These figures represented a drop in planned investments from last year. Similarly, when asked about their firm’s investment plans over the next three years, 62% of respondents indicated they would spend less than $250,000, which was the highest percentage for that category (the smallest dollar amount) since the 2020 study. These results might signify hesitation to invest given the relatively challenging current business conditions. Interestingly, for those respondents who gained sales volume in 2025, 53% planned to invest more in 2026 than in 2025; for those who lost sales volume, just 28% planned to invest more.
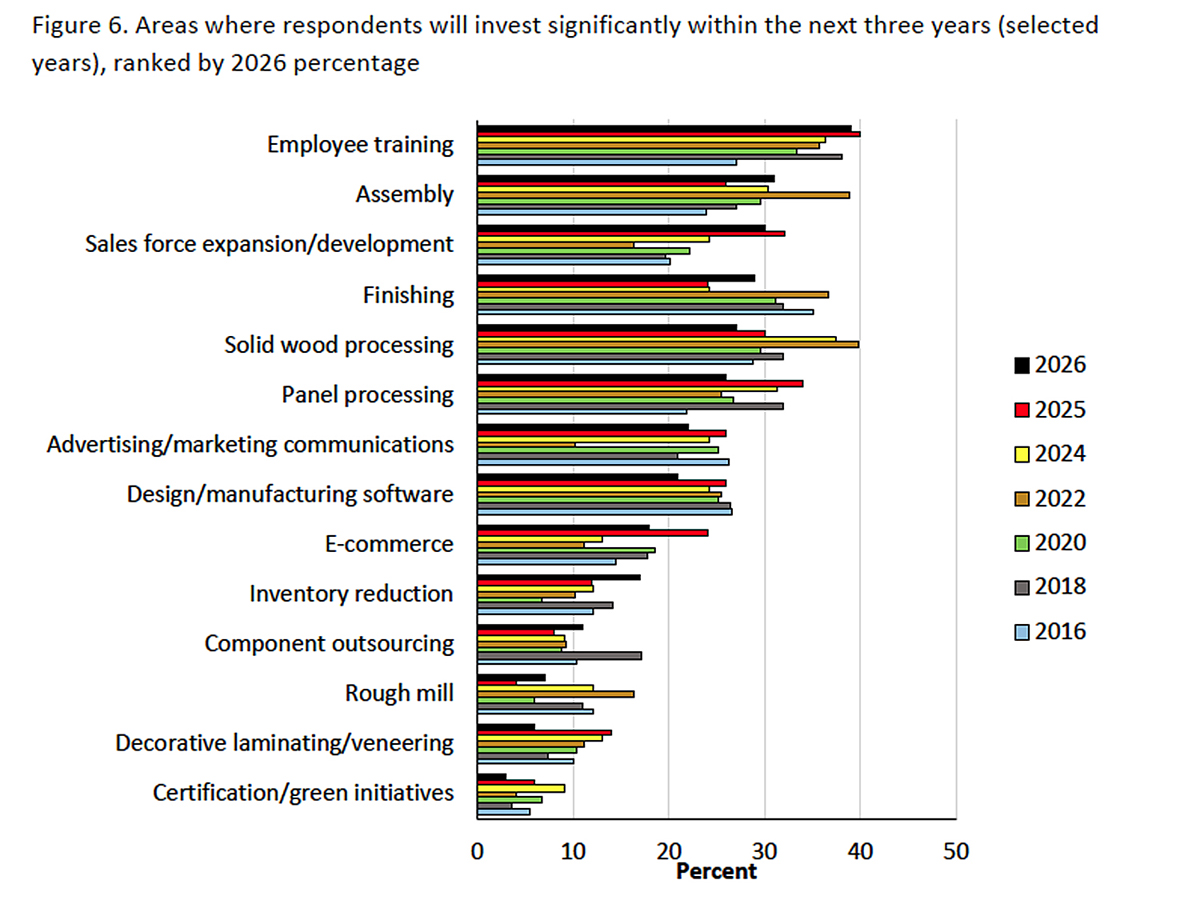
The study also assessed the general categories and areas where investments were planned over the next three years (Figure 6). As in recent years, employee training (39%) was the most common investment area. Some respondents also qualitatively noted a focus on hiring more qualified people for openings. Sales force expansion/development also was rated relatively highly (30%) as an investment. Qualitative comments referring to developing larger sales teams also were mentioned by some respondents. This was the second consecutive year sales force investment was rated relatively highly, suggesting firms need to work harder in the current business environment to generate sales. In terms of manufacturing-based investments, assembly (31%), finishing (29%), solid wood processing (27%), and panel processing (26%) all were rated relatively highly, but all were rated somewhat lower than their peaks in recent past years.
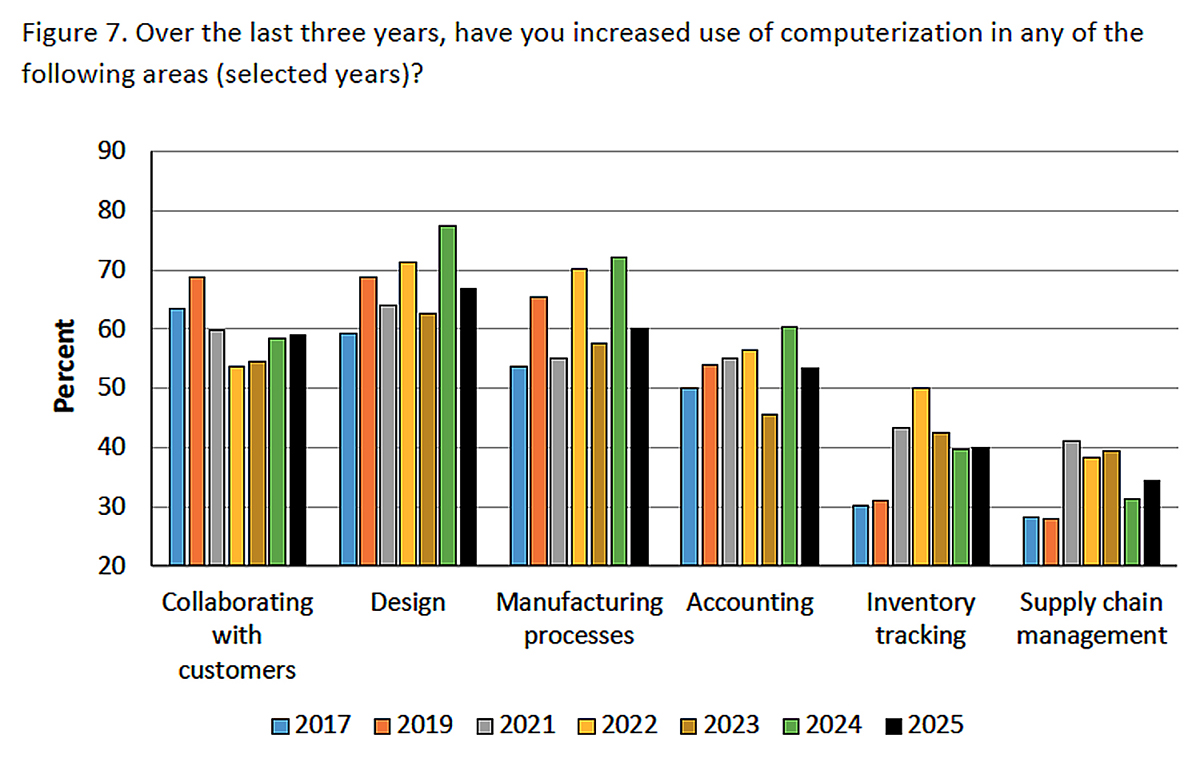
Respondents were asked to indicate if their firms had increased the use of computerization over the past three years in several functional areas. Most functional areas realized either a decrease or were similar to last year (Figure 7). The biggest declines occurred for manufacturing processes and design, which were lower by 12 percentage points and 11 percentage points, respectively. Accounting also was lower than last year. Areas that were relatively stable from last year included collaborating with customers, inventory tracking, and supply chain management. Design continues to be the area where computerization has increased the most, but all areas have seen increases in computerization when compared to no increase.
Summary
Notably, more secondary woodworking firms reported a decline in sales volume for 2025 compared to 2024, which was consistent with lower overall spending on single-family housing and fewer single-family housing starts. Respondents continued to focus mostly on single-family housing and remodeling, as only 19% and 13%, respectively, had no activity in these markets in 2024. According to respondents, downturns in single-family housing and remodeling were major reasons for losing sales volume in 2025. Softness in these markets seemingly is creating more difficult conditions for the secondary woodworking industry.
Corresponding to lower sales volume for the industry in 2025 was a decline in planned business investment activity. For 2025, fewer companies planned to invest, and the planned amounts were lower than in recent years. Additionally, fewer companies reported increased use of computerization in their operations in the 2025 study compared to 2024.
Employee training continued to be the area were the most respondents were planning significant investment activity in the next three years. Finding and retaining good employees remains an important objective for secondary woodworking companies. Companies also were planning investment activity in sales force expansion and development. Solid wood and panel processing continued to be relatively important areas for planned investments but were lower than in recent years; this again might be a function of reduced demand and the need to focus on generating sales.
For companies that had increased sales volume in 2025, no specific actions emerged to explain their relatively strong performance, although productivity improvements continue to be rated relatively highly as a reason for success. Increasingly, firms are instead indicating that their specific companies are generally realizing gains in sales volume relative to competitors or overall economic conditions, suggesting they are attributing success to internal factors and not external conditions.
About the survey
Now in its 17th year, the 2026 study was conducted in February/March/April via e-mail invitations sent by Woodworking Network/FDMC to their subscribers. Overall, 90 usable responses were received, a number similar to past years of the survey.
As in previous years, kitchen/bath cabinet producers comprised the largest percentage of the sample, representing 50% of respondents. Thirteen percent were household furniture producers, 9% were molding/millwork producers, and 7% produced office/hospitality/contract furniture. Other types of producers in the sample included architectural fixtures (6%), and dimension and components (6%). An additional 10% indicated their production was in “other” categories, including closets, custom cabinetry and stairway products.
Most responding firms were small, with 68% of respondents having 1-19 employees. This figure was 78% for the overall U.S. Furniture and Related Products Manufacturing sector (NAICS 337) based on 2022 Census data. In terms of sales, 46% of respondents had sales of less than $1 million in 2025, and another 36% had sales of $1-$10 million. The remaining firms had sales greater than $10 million.
Most respondents (71%) held positions in corporate or operating management or were the owners of their respective firms. Responses were received from 35 states and provinces, with CA, WI, NV, TX, CT, FL, GA, IL, PA, VA, and ON each accounting for at least 4% of total responses. Geographic markets served ranged from a high of 43% and 40% doing regular business in the U.S. Northeast and Midwest, respectively, to a low of 18% each doing regular business in the U.S. South and Northwest.
About the authors: Matt Bumgardner is with the Forest Products Laboratory, USDA Forest Service in Delaware, Ohio. Urs Buehlmann is with the Department of Sustainable Biomaterials at Virginia Tech, Blacksburg, Virginia. Karen Koenig is senior editor at FDMC/Woodworking Network.



Have something to say? Share your thoughts with us in the comments below.