Who's manufacturing the kitchen cabinetry, furniture, windows and doors, paint and other products in your house and how much are the shipments worth?
An interactive infographic by the U.S. Census Bureau provides the value of shipments and employment figures for various industries related to home products. The Housing-Related Manufacturing in America data is culled from the Annual Survey of Manufactures (ASM).
Click on the image to access the interactive graphic from the U.S. Census Bureau.
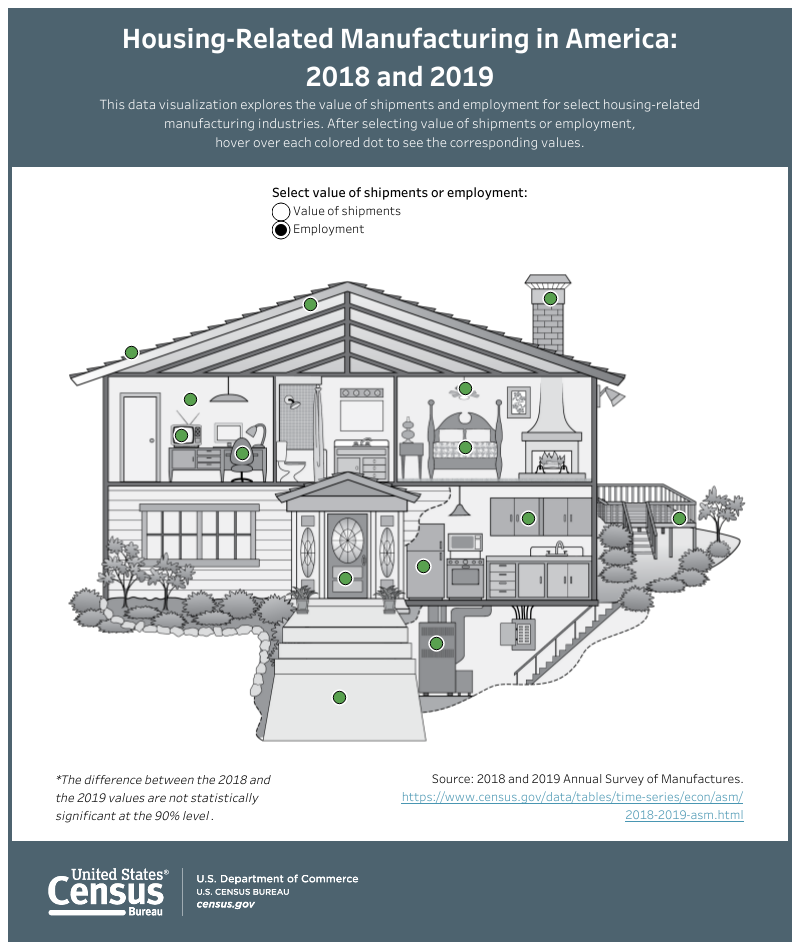
Users can select the "Value of shipments" tab or "Employment" tab and hover the cursor over the orange or green dot respectively to see the data. The ASM estimated total value of wood kitchen cabinet and countertop shipments (orange dot) was $15.2 billion in 2018, compared to $14.2 billion in 2019. The manufacturing employment figure for the industry was at 97,981 in 2018, before dropping to 89,719 in 2019.
The infographic serves as a lead-in to Oct. 1 Manufacturing Day.
More information on housing-related manufacturing can be found at the Census Bureau.


Have something to say? Share your thoughts with us in the comments below.