
How well is your business really doing? You might be in the black and have a good flow of work, but how does your operation compare with others in the woodworking industry?
That’s what we set out to find in a new survey project conducted with Preston/Rogers Associates Inc., a market research and media consulting firm, and sponsored by Hexagon (Alphacam and Cabinet Vision), a leading software company long serving the woodworking industry.
Woodworking Network’s editorial team partnered with Preston/Rogers to develop questions that strike at the heart of key benchmarks for comparing businesses in the industry. These include metrics on profitability, labor force, sales, and use of equipment and technology.
Results of the survey confirm some historic data, but they also suggest some trends, which should become clearer in future surveys as this project continues in succeeding years.

Size matters
Whether you measure woodworking businesses by employee numbers or revenue, clearly size matters in developing benchmark metrics. It also affects trends in the kinds of products manufactured. Interestingly, as smaller operations become more efficient and generate larger sales, the definition of what qualifies as a “small shop” has changed. Preston/Rogers developed natural segment divisions based on size and sales, qualifying only one-person shops as “small” based on employee numbers, with 2-10 employees as “medium,” and more than 10 as “large.”
Similarly, on sales, shops divide into small at under $500,000, medium at $500,001 to $5 million in annual sales, and large at more than $5 million.
Growing use of automation enables woodworking businesses to make more with fewer employees. Even one-person shops with CNC compete for business that once required a dozen employees or more. Two-thirds of survey respondents have 10 or fewer employees.
Key products
Of the product categories presented, the majority of respondents make residential cabinetry, followed by custom wood products, residential furniture and commercial cabinetry, with a lot of overlap among categories. One-person shops focus more on custom wood products and residential furniture and cabinetry. Larger shops, defined both by employees and sales, while also strong in those three products, are relatively stronger in the other categories, such as architectural millwork.
Residential cabinetry, residential furniture, and custom wood products were noted most as primary products by survey respondents.
Some 59% of one-person shops focus on residential furniture and custom wood products.
Longevity
Most businesses responding to the survey have been operating for more than 20 years. Larger organizations, based on both employees and revenue, are almost twice as likely to have been in business for over 20 years.
Companies whose primary products are residential and commercial cabinetry stand out for their longevity, with over two-thirds going strong after 20 years.
Plant size metrics
The size of a woodworking operation compared to the number of employees has long been a measure of business efficiency and success. The theory historically has been that a certain ratio of employees to square feet is most efficient and profitable. Too many employees for the plant size could be a signal for expansion of the plant or reduction in workforce, depending on other factors in the business. Too few employees compared to plant size can lead to wasted motion and inefficiency, but it also suggests the company could potentially produce more in the same space.
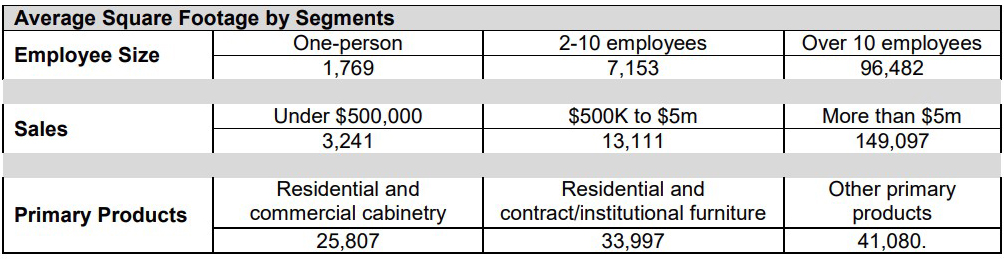
Survey respondents divided by segments show interesting results. By employee size, one-person shops averaged 1,769 square feet. Shops of 2 to 10 employees averaged 7,153 square feet. Companies with 10 or more employees averaged 96,482 square feet.
Based on sales, companies under $500,000 averaged 3,241 square feet. Between $500,000 and $5 million in sales generated an average plant size of 13,111 square feet. And those with more than $5 million in sales averaged 149,097 square feet.
Based on primary products, those focused on residential and commercial cabinetry averaged 25,807 square feet. Those emphasizing residential and contract/institutional furniture averaged 33,997 square feet. Other primary products came in at an average of 41,080 square feet.
Extrapolating from historic data and this survey data from segments, the survey confirms an industry standard of 1,000 to 1,500 square feet per employee. Similarly, the data seems to support a minimum average goal of $50 in sales per square foot.

Sales metrics
Although more than 40% of respondents have annual sales under $500,000, overall average sales are $2.5 million because of the large companies. One-person shops averaged about $274,000 sales.
Compared to the previous year, overall, about half of survey respondents had better sales, and 39% had the same sales. Two-thirds of one-person shops had about the same sales, while larger organizations were much more likely to have had somewhat better sales.
Sales were up because of raised prices, productivity improvements, recovery from COVID, and new markets and products, in that order. Larger companies and residential and commercial cabinetry producers were more likely than others to cite productivity improvement and raised prices.
The general economy, inflation and supply chain issues were cited by respondents with lower sales, and the COVID hangover is still affecting sales. Still, reasons for lower sales were fairly universal across company sizes and product groups.
The good news is most respondents expect sales to be better in 2023, and 88% expect better or same. One-person shops are more likely to expect sales to be the same. Based on product category, responses were similar on this issue.
Profitability
Average profit margin for 2022 across survey respondents was 21%, with lots of variation. Reported profit margins for smaller shops were higher, 24%, compared to mid-sized, 21%, and large 18%. Almost one-third of respondents skipped the question, suggesting either a lack of tracking or privacy concerns.
This also could suggest the true overall profitability average is somewhat lower than these numbers with companies less willing to report poorer numbers.
Historically, we’ve seen profit margins reported more regularly in the 12-18 percent range across the industry. As we continue this survey going forward, it will be interesting to see how the numbers work out over time.
Profit vs. price
The overall average profit margin built into estimates for pricing and bidding was reported as 29%, with a lot of variation. Note the significant difference between that number and the 21% annual profit reported.
Preston/Rogers, the survey firm, speculated that, based on the dispersion of reported rates, there may be multiple definitions of profit or perhaps how overhead is accounted for. They also suggested that large organizations build in a lower profit rate, perhaps related to their dependence on competitive bidding.
Historically, we found a significant disconnect between the profit numbers built into the initial price of woodworking products and the annual profit of the company. Almost universally this relates to not tracking all real costs of labor, materials, and overhead in the pricing process.
Calculated benchmarks
Survey data correlates well with historic industry benchmarks of $200,000 to $250,000 in sales per employee in profitable shops. The survey data for square feet per employee are just a bit higher than historical industry standards of 1,000 to 1,500 square feet per employee.
Total average revenue per employee across all segments was $213,510. Breaking out the averages by segment, the largest shops came in at $153, 238, mid-size shops reported $214,785, and one-person shops reported the highest revenue per employee of $273,810. That last number clearly reflects a skew in the respondents toward long established shops with decades of experience. Clearly one-person shops just starting out are not making those figures.
Square foot per employee
The average square foot per employee across all segments was reported as 1,558. By segments, the number was once again largest in the one-person shops at 1,769. Medium-size operations came in at 1,301 square feet per employee, and the largest plants reported 1,670 square feet per employee.
The higher number in the smallest shops reflects the simple reality in the woodworking industry that you need a minimum amount of space to accommodate all the machinery for all the processes involved. With only one person running all the machines, there is naturally a higher square-foot number per person.
Numbers in the medium and larger plants more reflect the efficient relationship of space to employee and efficient use of machinery and space. It will be interesting to track these numbers over time as we repeat the survey and as the industry continues on a path of increasing automation suggesting a trend for fewer employees and more machinery in the plant.
Labor force and operations
The majority (54%) of respondents don’t plan any labor force changes in 2023, but 41% are either upsizing (18%) or would if they could find skilled workers (23%). Only 5% plan to downsize.
Mid and (especially) large companies, compared to one-person shops, are planning to upsize and would do so even more if skilled workers could be found. The distribution of responses is consistent across product groups. Entry level employees average $18 hourly, and that is fairly consistent across the product segments.
Some 17% (52% of one-person shops) answer “don’t know” perhaps reflecting that starting wages vary, or they just don’t hire.
Although larger organizations are more likely to pay in the $13 -$20 range, smaller shops pay disproportionately in both the lower and higher ranges, so averages are fairly close across business sizes.
After 5 years experience, hourly average wages increase to $24, with a similar pattern to entry-level, as larger companies tend to pay in the mid ranges and smaller companies are at the lower and higher ends of the spectrum, or don’t know.
Training
Less than a third of respondents have employee training programs, but about half of large companies have them. Residential and contract/institutional furniture makers are less likely to offer formal training.
Naturally, most training is hands-on with various forms of apprenticeships, sometimes preceded by orientations, safety or HR policies.
Only 16% plan to add training programs in 2023. But mid and large companies are much more likely to be expanding training. Residential and contract/institutional furniture makers are less likely to be planning new training. New training program descriptions vary by individual circumstances.
Less than 2% use the Woodwork Career Alliance Passport program and 54% don’t know what it is, although it is unknown to only 41% of large companies.
Outsourcing
While 28% of respondents are manufacturing 100% of their finished products, the remaining almost three-quarters are partially outsourcing; still, the average is 84% in-house manufactured value.
One-person shops average higher, with 92% manufactured value in-house.
Lean manufacturing
While 29% are fully on board with lean manufacturing, another 35% are trying or interested, but over a third are not interested. Interest in lean manufacturing is also positively related to company size.
Bidding
The overall average of competitive-bid work is 27%, ranging from 12% for small companies, 28% for mid and 43% for large companies.
Almost 30% of respondents do no competitive bidding, and almost half do none or less than 10%.
This varies greatly by company size, with almost two-thirds of one-person shops having no competitive bidding, versus 14%-16% for mid and large companies.
And, at the high end, large companies report bidding for more than half their business at 44% compared to mid-sized at 20%, or small at 8%.
Residential and contract/institutional furniture makers stand out as the largest product category with no bidding at 47%.
Bid success
There is a lot of variation on success with competitive bids among those who engage in them, with the average being just over half (5.5 of 10) coming through. Smaller organizations report a higher success rate, averaging 6.2 compared to 5.9 for mid and 4.6 for large organizations.
Historical data suggests bid success rates and a lack of competitive bidding both relate to the high level of negotiated (non-bid work) with regular, repeat contractors or clients. For those who do mostly bid work, a “sweet spot” of 2-3 out of 10 is often considered the most profitable range for successful bids. Higher ratios suggest low bidding or willingness to take on too many low-price jobs.
Software
Two-thirds of respondents’ companies use CAD/CAM software, as well as bookkeeping applications, Less than 40% use software for estimating, tracking time and sales, and even lower proportions for enterprise solutions.
Some 12% don’t use software for any of the listed functions (31% of one-person orgs). Smaller organizations use less of all types of software than larger organizations, with mid-sized companies in between.
Enterprise-level software has achieved little traction in organizations with 10 or less employees, but 45% for sales management, 37%for ERP, 28% for MES.
Machinery
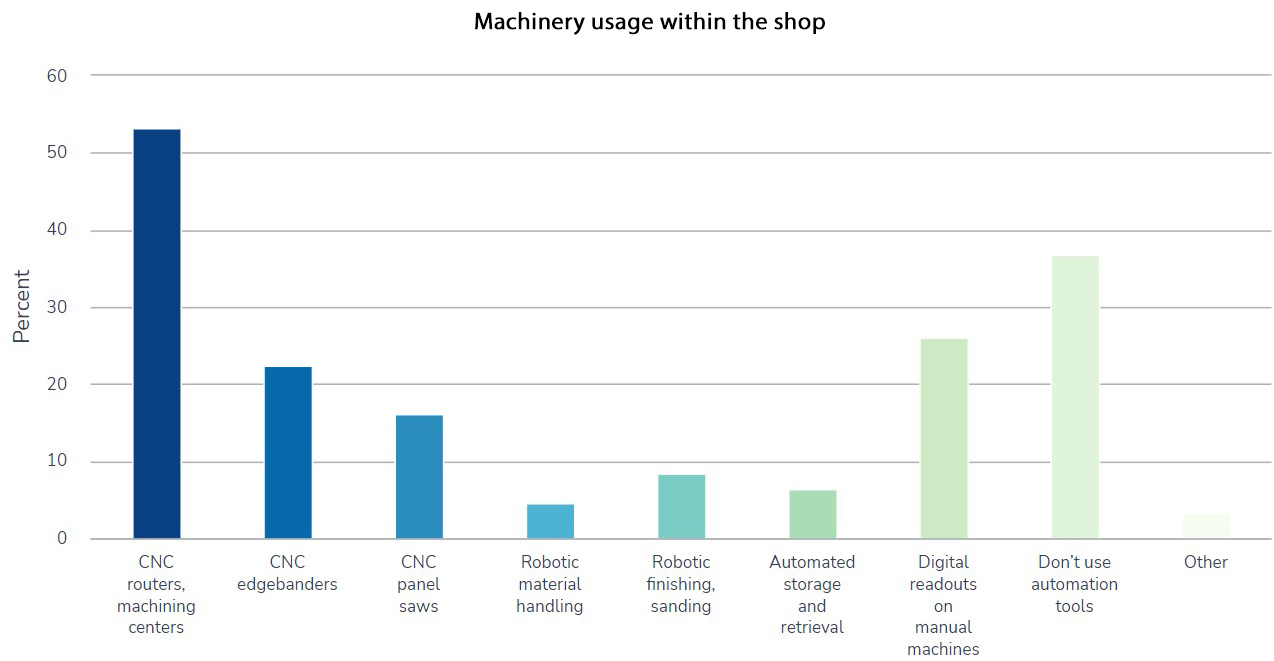
More than half of respondents use CNC routers, followed by digital readouts, CNC edgebanders and CNC saws. Some 36% don’t use any automation tools, including 71% of one-person shops.
More than half plan to invest in new equipment in the next two years, even higher (66%) for large organizations.
About the survey
The survey is based on a representative sample of 241 respondents from the Woodworking Network audience. The survey was conducted by email in January and February and has an overall confidence rating of 95% with an error rate of plus or minus 6%.
Sponsorship of the survey was provided by Hexagon, a leading software company with brands Alphacam and Cabinet Vision widely used in the woodworking industry.


Have something to say? Share your thoughts with us in the comments below.