
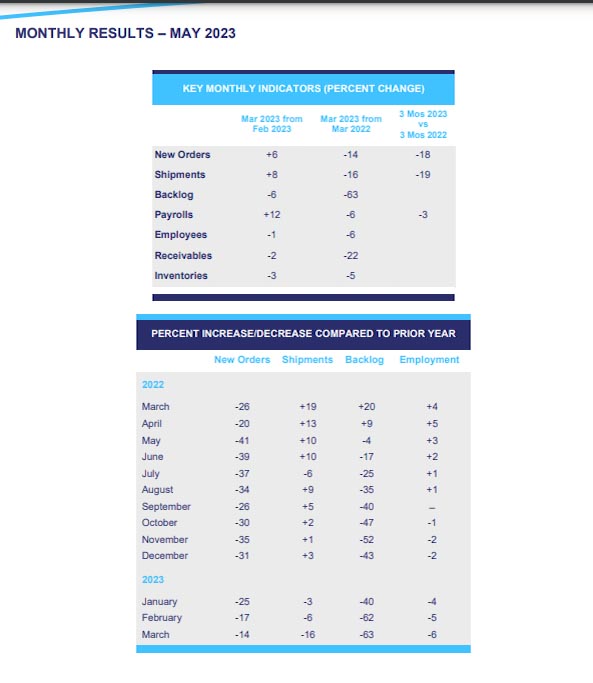
New orders in March 2023 fell 14% from March 2022 levels according to Smith Leonard's latest survey of furniture manufacturers and distributors, continuing the monthly declines from the previous year.
New orders were down for 71% of the participants. Year-to-date, new orders were down 18% compared to the first quarter of 2022. Year-to-date orders were down for 78% of the participants.
Shipments were down 16% from last March and down 19% year to date. For the month, shipments were down 61% and down year-to-date for 56% of the participants. Several participants are continuing to ship from healthy backlogs while others have brought backlogs down to more normal levels and are shipping from current order rates, reversing the trends we had seen when orders were down, but shipments were up.
Once again, backlogs fell from 2022 levels, down 63% from March 2022 and down 6% from February. Some of the participants continue to have larger backlogs so overall backlog total dollars remain higher than pre-pandemic, but we would expect that much of that increase is likely due to price increases.
Receivable levels remain in line with the decrease in year-to-date sales, but we continue to hear that there is some slowdown in the quick payments that were received when there was a shortage of goods deliverable. Inventory levels declined again and were down 5% from March 2022.
Employment results seem in line and while the number of employees was down from last year, we think that is likely attrition from marginal employees hired when finding employees was so difficult and some were hired despite their experience or skills.
National Consumer Confidence
The Consumer Confidence Index declined in May as both the Present Situation Index and the Expectations Index fell. The Expectations Index was below 80 again, the level that is associated with a recession within the year. The report noted that May’s decline reflected a particularly worsening in the outlook among consumers over 55 years of age. Plans to purchase homes in the next six months held steady but the report noted that plans to purchase autos and big-ticket appliances ticked up compared to April. Hopefully, that includes furniture.
Housing
Total existing-home sales slid 3.4% from March to a seasonally adjusted annual rate of 4.28 million in April. Year-over-year, sales fell 23.2% from April 2022. All four regions of the country were down significant double digits from last year’s April results.
Single-family home sales fell 3.5% in March and 22.4% from the previous year. The median existing single-family home price was $393,300 in April, down 2.1% from April 2022.
Existing condominium and co-op sales were down 2.3% from March and 29.5% from one year ago. The median existing condo price was $348,000 in April, an annual increase of 0.7%.
"Home sales are bouncing back and forth but remain above recent cyclical lows," said NAR Chief Economist Lawrence Yun. "The combination of job gains, limited inventory, and fluctuating mortgage rates over the last several months have created an environment of push-pull housing demand."
Sales of new single‐family houses in April 2023 were 4.1% above the revised March rate and 11.8% above the April 2022 estimate.
Compared to April 2022, sales in April were up 20.6% in the Midwest and 23.4% in the South, while declining 46.7% in the Northeast and 2.8% in the West.
Privately owned housing starts in April were 2.2% above the revised March estimate but were 22.3% below the April 2022 rate. Single‐family housing starts in April were 1.6% above the revised March figure but down 28.1% from last April.
Single-family starts regionally compared to April 2022 were down 42.6% in the Midwest, 27.6% in the South, and 29.2% in the West, offset by a 15.1% increase in the Northeast.
Other
Advance estimates of U.S. retail and food services sales for April 2023, were up 0.4% from the previous month, and up 1.6% above April 2022. Total sales for the February 2023 through April 2023 period were up 3.1% from the same period a year ago.
Retail trade sales were up 0.4% from March 2023, and up 0.5% above last year. On an adjusted basis, sales at furniture and home furnishings stores were down 6.4% from last year and down 1.6% year-to-date.
The Consumer Price Index for All Urban Consumers (CPI-U) rose 0.4% in April on a seasonally adjusted basis, after increasing 0.1% in March. The index for shelter was the largest contributor to the monthly all-items increase, followed by increases in the index for used cars and trucks and the index for gasoline. The food index was unchanged in April, as it was in March.
The all-items index increased 4.9% for the 12 months ending April; this was the smallest 12-month increase since the period ending April 2021.
Real gross domestic product (GDP) increased at an annual rate of 1.3% in the first quarter of 2023, according to the "second" estimate released by the Bureau of Economic Analysis. In the fourth quarter, real GDP increased by 2.6%
The increase in real GDP reflected increases in consumer spending, exports, federal government spending, state and local government spending, and nonresidential fixed investment that were partly offset by decreases in private inventory investment and residential fixed investment. Imports, which are a subtraction in the calculation of GDP, increased.
The Conference Board Leading Economic Index® (LEI) for the U.S. declined 0.6% in April 2023 to 107.5, following a decline of 1.2% in March. The LEI is down 4.4% over the six months between October 2022 and April 2023.
“The LEI for the US declined for the thirteenth consecutive month in April, signaling a worsening economic outlook,” said Justyna Zabinska-La Monica, Senior Manager, Business Cycle Indicators, at The Conference Board. The Conference Board forecasts a contraction of economic activity starting in Q2 leading to a mild recession by mid-2023.”
HIGHLIGHTS – MONTHLY RESULTS
New Orders
According to our latest survey of furniture manufacturers and distributors, new orders in March 2023 were down 14% compared to March 2022, when they were down 26% from March 2021 (for reference, March 2021 orders were up 96% over March 2020, the beginning of the pandemic, and March 2020 orders were down 29% due to a short month of operations as the pandemic set in and shut most down). Considering all the things that have affected comparisons, like the raw material price increases, freight ups, and downs, labor shortages, and rate increases, the best comparisons are made by looking at your individual company results and making your comparisons. Approximately 71% of the participants reported lower orders vs March a year ago.
Year to date, orders were down 18% for the quarter compared to the first quarter of 2022. Orders were down for 78% of the participants.
Shipments and Backlogs
Shipments were down 16% in March vs March 2022. Shipments were down for 61% of the participants. For the quarter, shipments were down 9% compared to the first quarter of 2022. Shipments were down for 56% of the participants year to date. As can be seen below, backlogs have continued to fall so shipments are starting to follow new order rates more closely.
Backlogs were down 63% from March 2022 and down 6% from February. While for many, backlogs are still higher than in previous times, most are beginning to follow traditional lead times more closely.
Receivables and Inventories
Receivable levels were down 22% from March a year ago, somewhat reflecting the decrease in shipments of 19% year to date. We continue to believe that receivables will need to be watched closely as sales at retail continue to slow for many, putting pressure on cash. Fortunately, most have taken advantage of the PPP money as well as the Employee Retention Credits, allowing most to build cash during this time of the pandemic.
Inventory levels fell 3% from February and reported a 5% decline from March 2022. We expect that while, with business slowing, inventory levels will remain somewhat high as many are not taking chances on shortages, due to the problems created during the pandemic.
Factory and Warehouse Employees and Payroll
The number of factory and warehouse employees fell 1% from February 2023 and was down 6% from last March 2022. We would expect most of this to be through attrition as most companies were hiring anyone they could find during the run-up in business.


Have something to say? Share your thoughts with us in the comments below.